Datadog
Spice can be monitored with Datadog using the Spice Metrics Endpoint and pre-built dashboards available in the Spice repository.
Datadog Agent Configuration
Prerequisite: Datadog Agent version 6.5.0 or later is installed.
Configure the Datadog Agent to scrape the Spice metrics endpoint:
- Edit the
openmetrics.d/conf.yamlfile in theconf.d/folder at the root of your Agent’s configuration directory:
init_config:

instances:
    - prometheus_url: SPICE-METRICS-ENDPOINT>/metrics # for example http://localhost:9090/metrics
      namespace: spice
      metrics:
          - '*'
- Restart the Agent to start collecting Spice metrics.
- Refer to Prometheus and OpenMetrics metrics collection from a host for all available configuration options and supported parameters.
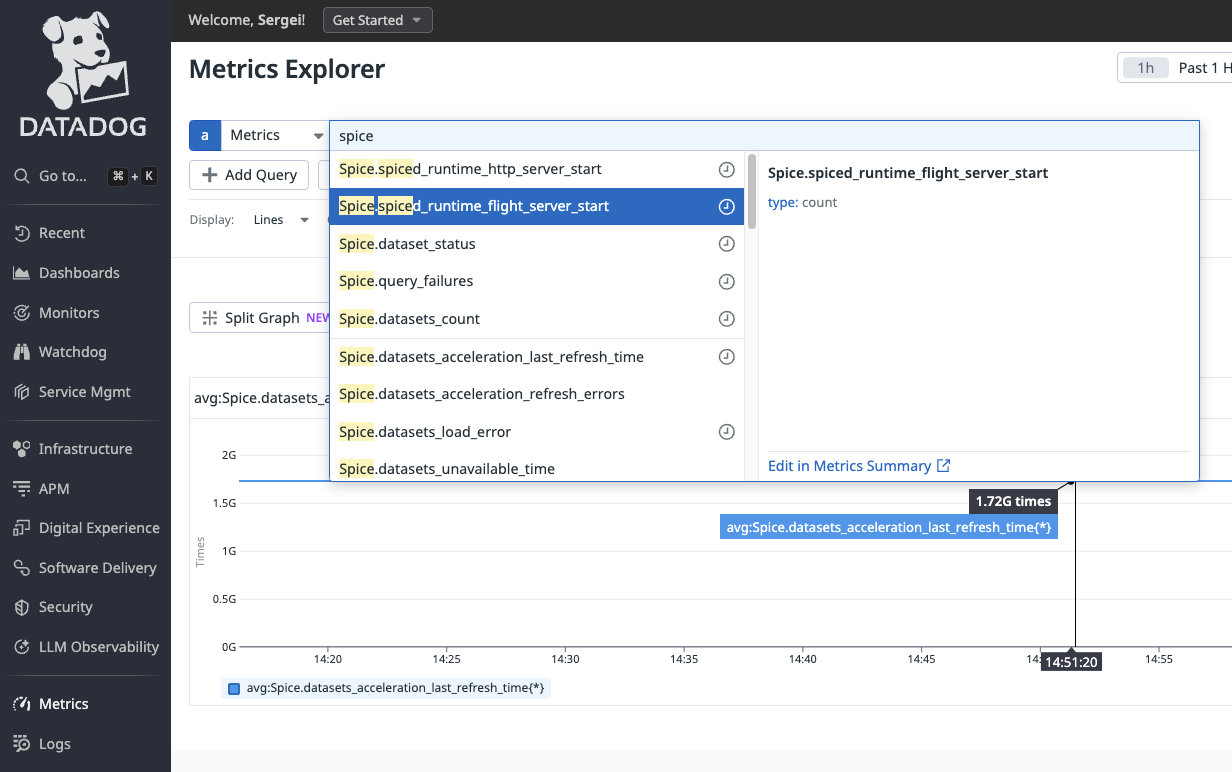
- Open Datadog Metrics Explorer and type
spiceto confirm Spice telemetry information is successfully collected.
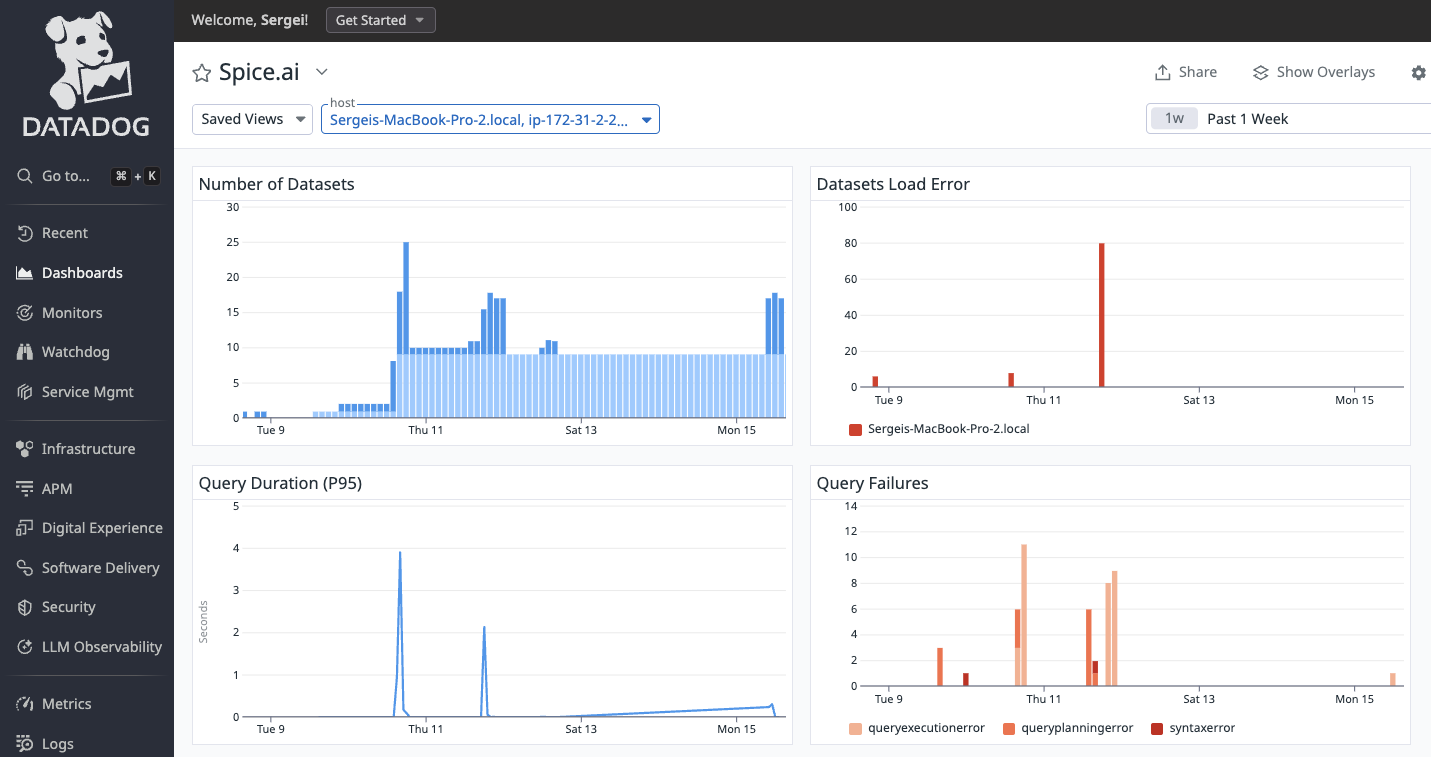
Import the Spice Datadog Dashboard
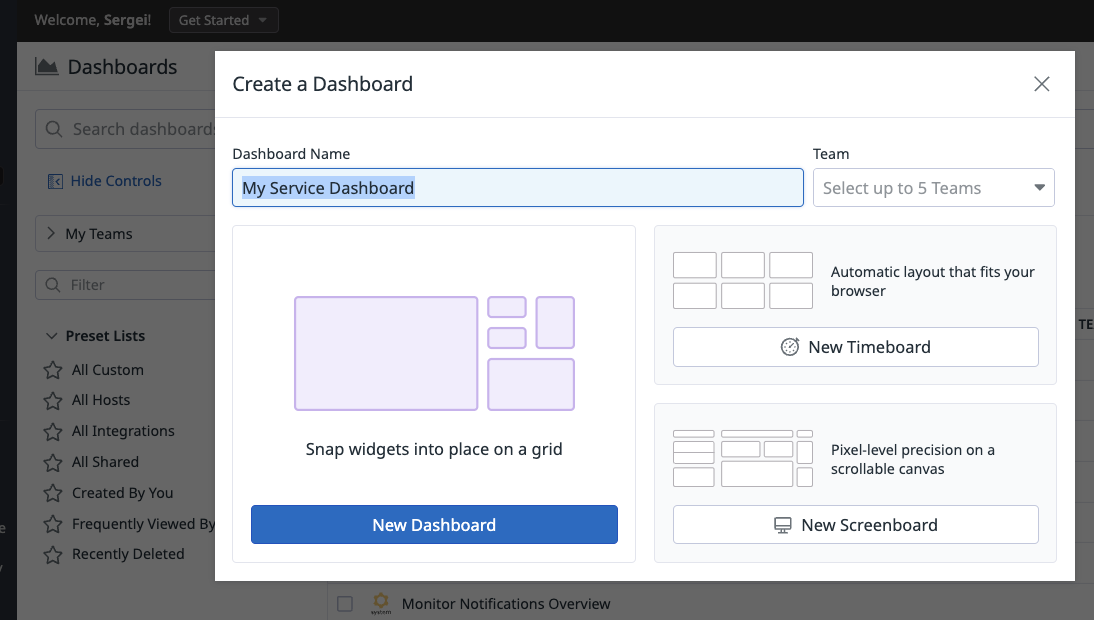
- Create New Datadog Dashboard
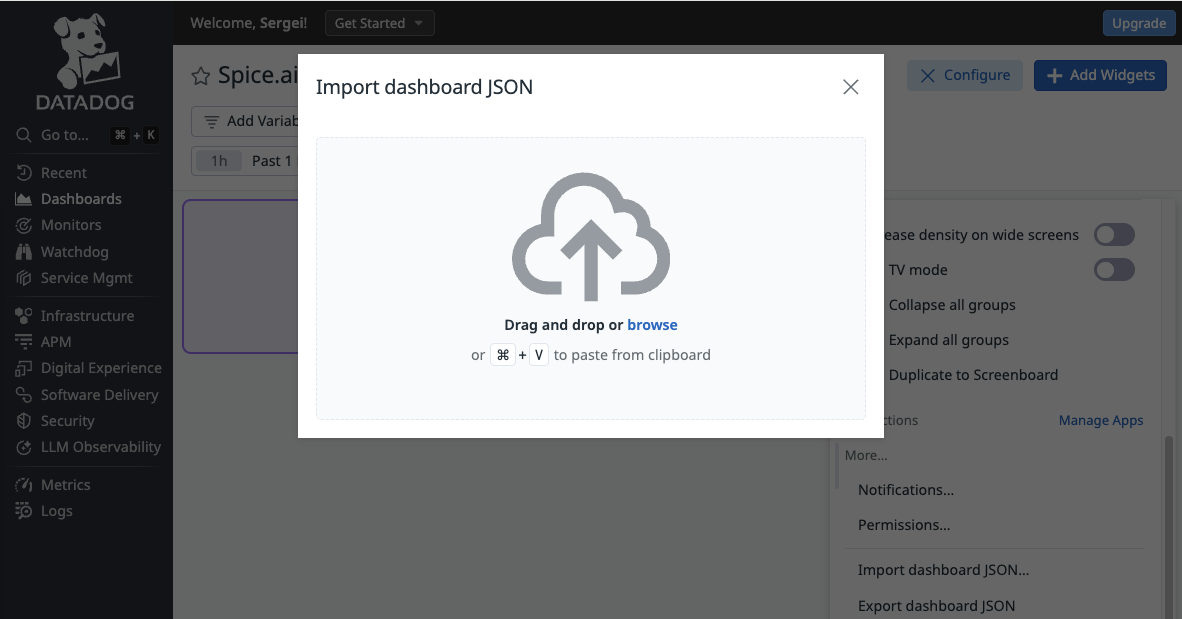
- Click Import dashboard JSON and drag and drop monitoring/datadog-dashboard.json file
- Dashbord is now configured to display Spice.ai OSS key performance metrics